Media Buyer Dashboards and Reporting in 2026: One Screen of Truth Instead of Ten Platforms
A media buyer’s morning without a dashboard: ten platform tabs, the CRM, a currency-rate sheet, and a client asking “so, how are the numbers?” An hour goes just to assembling the picture — decisions start after lunch. Dashboards flip that equation: one screen of truth where spend is stitched to deals, plan to actual, and anomalies light up before you’ve opened a single ad platform.
Architecture: where the one screen of truth comes from
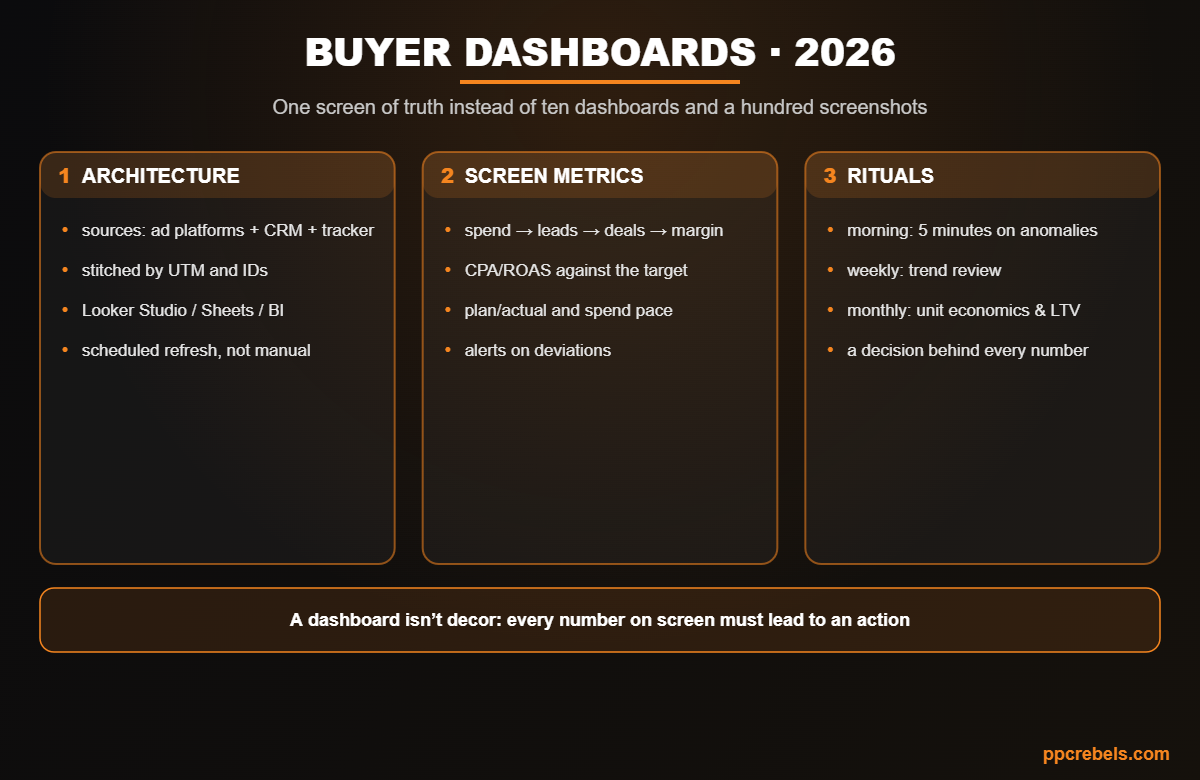
- Sources: ad platforms (spend, clicks, platform conversions), the CRM (leads, qualification, deals, money), analytics/tracker (GA4 or the server-side setup from tracking).
- Stitching by UTM and IDs: the “click → lead → deal” thread lives on labeling discipline: one UTM template, client_id/lead-ID passed into the CRM. Without it a dashboard is a collage, not a system.
- Tools sized to the job: Looker Studio + connectors is the standard start; Google Sheets with scripts is the flexible budget option; BI (Power BI, Metabase) when sources and teams multiply.
- Scheduled refresh, not by hand: daily auto-load minimum; intraday spend data for active management.
Screen metrics: the funnel down to money
- A row per source/campaign: spend → leads → qualified leads → deals → revenue/margin. A funnel cut off at “leads” is the top reason junk channels win budgets.
- CPA/ROAS against the target, not in a vacuum: the target from unit economics right on screen, deviation in color.
- Plan/actual and pace: spend and results vs the monthly plan, plus a “where we land at this pace” forecast.
- Alerts: sharp spend/CPA deviations, zero conversions, “Limited by budget” — from the monitoring scripts straight into the dashboard or messenger.
- The one-screen rule: anything that doesn’t lead to an action goes to a second page. Nobody reads a 40-widget dashboard.
Rituals: a dashboard works when it’s looked at
- Morning, 5 minutes: yesterday’s anomalies — spend, CPA, alerts. Not analysis; a “is anything on fire?” check.
- Weekly, 30–60 minutes: source trends, winners/losers, budget and test decisions — logged in writing.
- Monthly: reconciliation with the CRM and money, per-channel unit economics, target review. Client reports carry conclusions and actions, not data dumps: interpretation is what gets paid for.
- Versions of truth: platform, GA4 and CRM numbers will diverge — that’s normal; declare what counts as money (usually the CRM) and say so on the dashboard.
Common mistakes
- A 40-widget showcase dashboard with zero decisions.
- A funnel ending at “leads” — and budgets flowing to junk-lead channels.
- Manual “Friday updates” that die within a month.
- UTM chaos — and the stitching falls apart.
- Client reports without conclusions: numbers without interpretation are worth nothing.
FAQ
Looker Studio: free, native Google-stack connectors, fast start. Sheets with scripts when you need custom logic; BI when sources and users multiply.
Spend, leads/deals, CPA or ROAS against the target, monthly plan/actual and alerts. Everything else goes to additional pages.
One UTM template across all campaigns plus identifiers (client_id, lead ID) passed into the CRM. Then the stitch is a connector or a simple JOIN in a sheet.
Different attribution models, windows and time zones. That’s normal: declare a source of truth for money (usually the CRM) and don’t chase penny-perfect matching.
Automatically at least daily; spend and alerts more often (every 1–3 hours) under active management. Manual refresh is a temporary fix that always dies.
Bottom line
Media buyer dashboards are one screen of truth: sources stitched by UTM down to money in the CRM, CPA/ROAS judged against unit-economics targets, plan/actual and alerts highlighting problems, and morning, weekly and monthly rituals turning numbers into decisions. Build it once — and the hour of morning routine becomes five minutes of control.
Read also
- Traffic arbitrage & CPA marketing 2025–2026: the complete guide
- PPC Rebels and Coronium.io: mobile proxies for arbitrage and SEO in 2026
- Google Ads agency accounts 2026: the complete media buyer’s guide
Related reading: AI Max Reporting in Google Ads 2026: The Unified Journey View for Search Terms, Creatives and Landing Pages